Official Chrome Extension · Manifest V3
Flame Browser Bridge
Connect your real Chrome profile to Flame IDE so permission-gated AI agents can inspect, debug, and control browser tabs during development.
Capabilities
Observable, permission-gated browser control
Everything an AI agent needs to assist with frontend development, UI testing, and network debugging.
🌐
Tab Discovery & Inspection
List, activate, and navigate active Chrome tabs. Read live DOM trees, rendered HTML, text contents, and accessibility element snapshots directly from your development profile.
🔍
DevTools & Console Errors
Stream real-time browser console logs, JS errors, failed network requests, and Chrome DevTools Protocol (CDP) network events to Flame IDE.
📸
Visual Evidence Capture
Capture crisp viewport, full-page, or specific element screenshots so AI agents can inspect layout rendering, CSS bugs, and UI states.
⌨️
Gated Inputs & Actions
Send trusted synthetic mouse clicks, key events, and scroll gestures or evaluate page JavaScript after explicit tool permission approval inside Flame.
🍪
Cookie & Header Management
Read, set, or delete session cookies and apply per-tab request/response header rules using Manifest V3 session rules.
🔒
Loopback Privacy
Connects only over loopback (`127.0.0.1:4317`). No external remote servers, telemetry endpoints, or passive typing keyloggers.
Step-by-step setup
How to pair Flame Browser Bridge with Flame IDE
Pairing takes less than a minute and uses a secure loopback connection.
1
Install from Chrome Web Store
Install Flame Browser Bridge directly from the official Chrome Web Store listing.
2
Generate a Pairing Code in Flame IDE
Launch Flame IDE on your computer. Navigate to Settings > Browser Control > Chrome Browser Bridge and click Create pairing code. Flame will generate a short-lived, single-use, high-entropy pairing code.
3
Pair from the Extension Popup
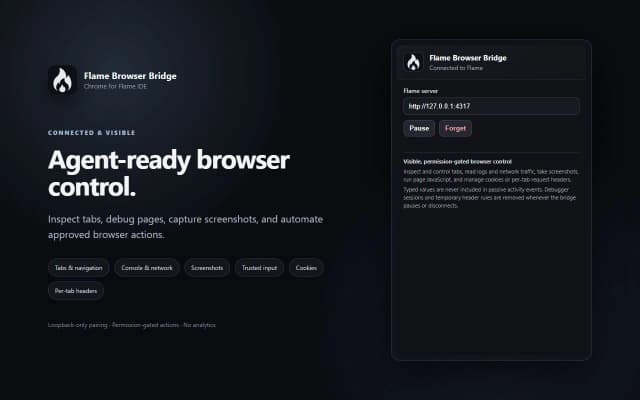
Click the Flame Browser Bridge icon in your Chrome extensions bar. Review the initial data-use disclosure, paste your pairing code into the input field, and click Pair with Flame.
4
Verify Connection & Approve Tool Prompts
The extension popup will display a green ON status badge indicating active loopback connection. When an AI agent in Flame requests browser inspection or action, approve the tool prompt in Flame to grant execution.
Bridge Management
Full user control and instant revocation
You remain in control of when the bridge is active and what data agents can access.
Pause
Temporary Detach
Pauses active bridge sessions, detaches CDP debuggers, removes temporary header rules, and clears extension log buffers without clearing your pairing key.
Forget
Remove Local Pairing
Clears stored bridge credentials and server settings from Chrome local storage. Requires generating a new pairing code to reconnect.
Revoke
Invalidate from IDE
Revoke access inside Flame IDE Settings (Settings > Browser Control > Chrome Browser Bridge). Immediately invalidates the token and purges Flame's in-memory activity trail.
Feedback & Support
Help shape Flame Browser Bridge
Encountered an issue, want a new capability, or discovered a security concern? Send feedback directly to our team.
🐛
Report a Bug
Tell us what went wrong, steps to reproduce, and unexpected bridge behavior.
💡
Request a Feature
Suggest new capabilities, tab controls, or developer workflows you'd like to see.
🛡️
Report Security Issue
Privately disclose potential vulnerabilities or loopback permission issues.
FAQ
Frequently Asked Questions
Common questions about Chrome permissions, safety, and operation.
Why does Flame Browser Bridge require the `<all_urls>` permission?
Flame IDE is a general-purpose web development environment. Developers test applications on local dev servers (http://localhost:3000), local staging domains, or production APIs. The `<all_urls>` permission allows the extension to inspect and interact with whichever origin you choose to debug.
How does Chrome Browser Bridge differ from Flame's internal browser?
Flame includes an integrated internal web view for instant side-by-side app previews. The Chrome Browser Bridge extension is a separate, optional integration that connects Flame's AI agents to your actual Chrome profile (with your existing sessions, cookies, extensions, and devtools state).
Can Flame agents control Chrome internal or extension pages?
No. Google Chrome strictly blocks extension debugging and script injection on internal pages (such as `chrome://` URLs, Chrome Web Store pages, and restricted settings).
Is my browsing data or typed text sent to cloud servers?
No. Flame Browser Bridge communicates exclusively over your local computer's loopback interface (`127.0.0.1:4317`). Passive activity logging captures click, scroll, and key metrics, but never typed input values. Tool results are processed locally by Flame IDE and only shared with your configured AI provider when needed to fulfill explicit agent prompts.
How do I report bugs, request features, or disclose security vulnerabilities for Flame Browser Bridge?
You can submit bug reports, feature requests, and confidential security issues directly from this page using the feedback options below, through Flame IDE Settings > Browser Control > Chrome Browser Bridge, or by contacting security@flame-ide.com.
Enhance Flame IDE with Chrome Browser Bridge
Install the official Chrome extension and start pairing your real Chrome tabs with Flame's AI agents.
Free to use on macOS, Windows, and Linux.